Property Intelligence Platform
Transforming property risk assessment for insurance underwriters through AI-powered insights and intuitive data visualization, reducing claim processing time by 40%.
Overview
Insurance underwriters were drowning in manual processes, spending hours analyzing property data from multiple disconnected sources. The challenge was to design an AI-powered platform that would transform complex property data into actionable insights, reducing claim processing time by 40%.
As a Lead UX/Product Designer, my role was to lead the creation of an intuitive data visualization platform that would make complex property risk data accessible and actionable for insurance underwriters.
My Contribution
- UX Design
- Product Strategy
- User Research
- Data Visualization
The Team
- 1x Product Manager
- 4x Engineers
- 1x Designer
- 2x Data Scientists
Research & Discovery
The project began with a deep dive into the current landscape of insurance underwriting processes and the challenges faced by underwriters when analyzing property data.
User Pain Points
- • 3-5 hours per property for manual data analysis
- • Inconsistent risk assessment methods across teams
- • Limited visibility into property condition changes
- • Reactive rather than proactive risk management
User Needs
- • Automated risk scoring with high accuracy
- • Real-time property monitoring and alerts
- • Intuitive data visualization
- • Streamlined workflows
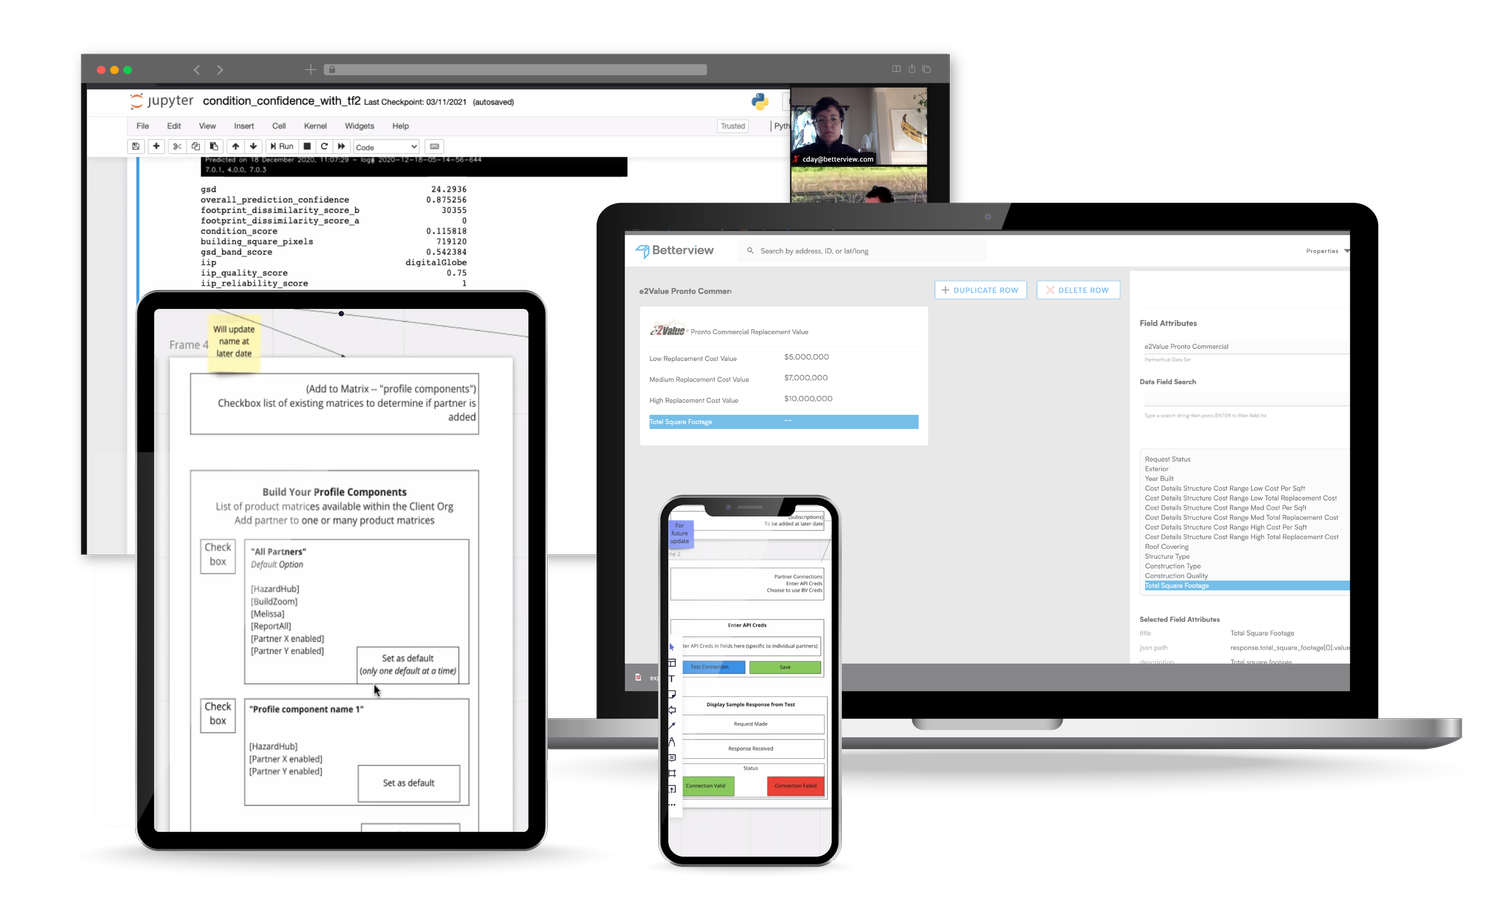
Property intelligence user research and wireframes
Design Development
The design process focused on creating an AI-powered platform that would transform complex property data into actionable insights. Through iterative design and user testing, we developed an intuitive interface that could handle real-time data processing while maintaining usability.
Key Features
- • AI Risk Scoring
- • Data Visualization
- • Real-time Monitoring
- • Customizable Alerts
Design Process
- • User Research
- • Wireframing
- • Interactive Prototyping
- • Usability Testing

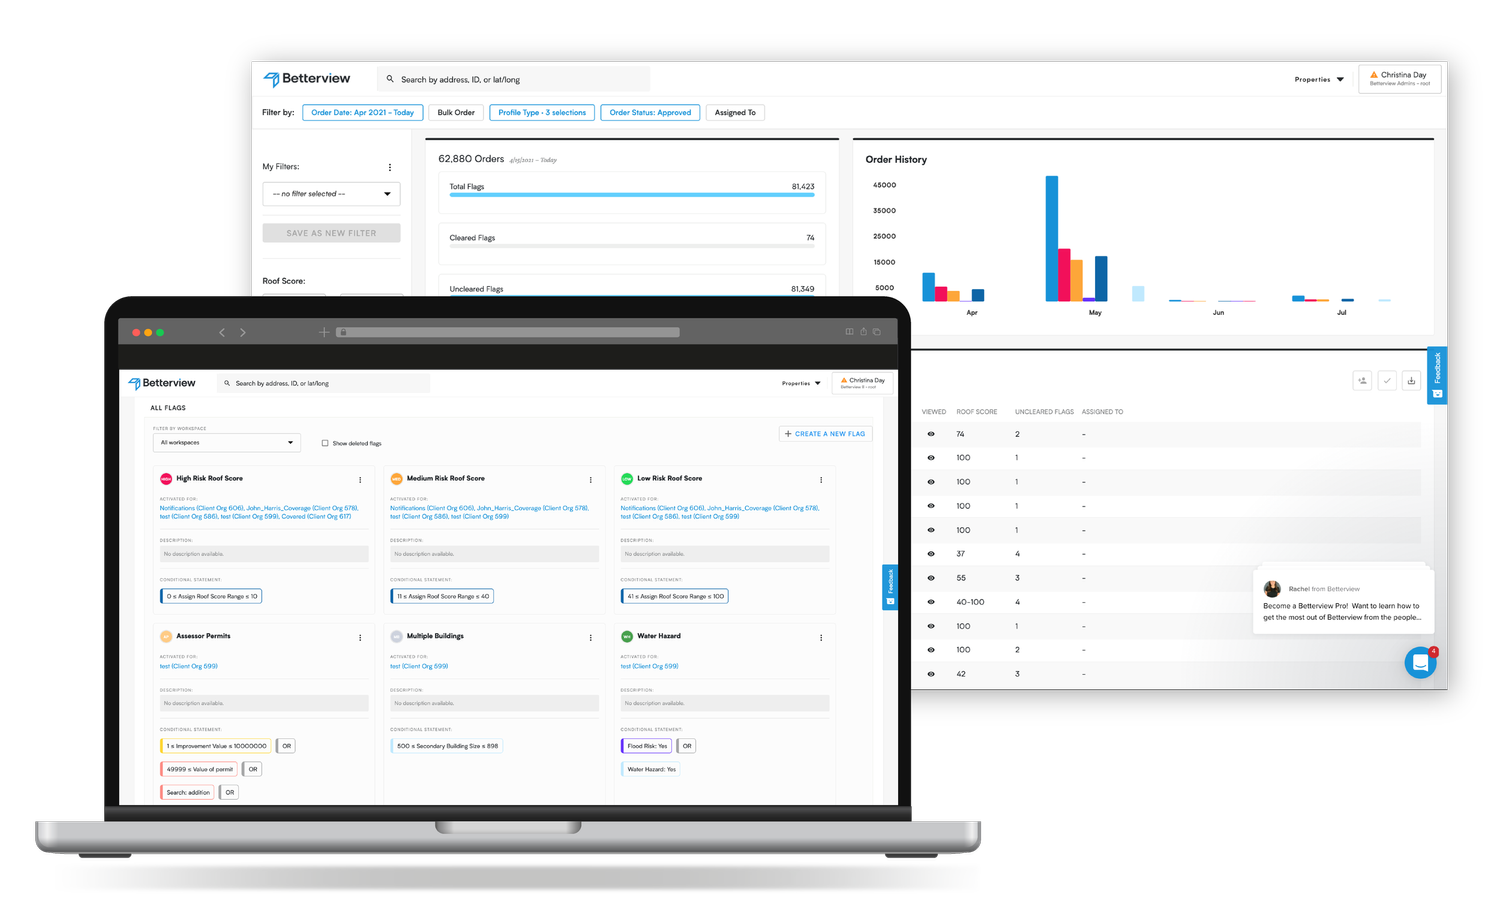
Property intelligence data visualization and interface design
Platform Features
AI Risk Scoring
Machine learning algorithms analyze property data to generate accurate risk scores automatically.
Data Visualization
Interactive dashboards that make complex property data intuitive and actionable for underwriters.
Real-time Monitoring
Continuous property monitoring with instant alerts for condition changes and risk factors.
Results & Impact
The platform revolutionized how insurance underwriters assess property risk, delivering measurable improvements in efficiency, accuracy, and cost savings.
Operational Efficiency
Reduced claim processing time by 40% and improved data accuracy by 60% through automated AI-powered risk assessment
Business Impact
Generated $2M+ in annual cost savings while serving 500+ active users across multiple insurance companies